
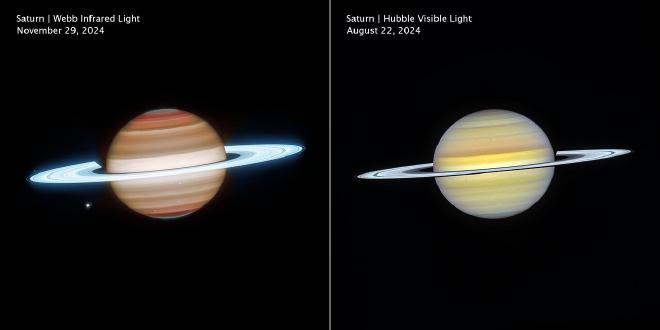
Side-by-side comparison of Saturn observed at different wavelengths and times show how differently it appears in infrared, on the left, versus visible light, on the right. Left image is labeled Saturn, Webb Infrared Light, November 29, 2024. Right image is labeled Saturn, Hubble Visible Light, August 22, 2024. In the infrared, Saturn has horizontal bands, with bands at the north and south poles appearing darker orange and lightening to tan as they approach the equator. The north and south poles glow a greenish-grey. The rings appear in an icy neon white. White dots represent several of Saturn’s moons. In visible light, Saturn’s horizontal bands appear pale yellow, with some bands towards the north and south pole having a light blue hue. The rings appear bright white, glowing slightly less than Webb’s infrared image. White dots represent several of Saturn’s moons
Together, scientists can effectively ‘slice’ through Saturn’s atmosphere at multiple altitudes, like peeling back the layers of an onion. Each telescope tells a different part of Saturn’s story, and the observations together help researchers understand how Saturn’s atmosphere works as a connected three-dimensional system.
The Hubble image shared here was captured as part of a more than a decade long monitoring program called OPAL (Outer Planet Atmospheres Legacy) in August 2024, while the Webb image was captured a few months later using Director’s Discretionary Time.
On Webb’s image #
In the Webb image, a long-lived jet stream known as the “ribbon wave meanders across the northern mid-latitudes, influenced by otherwise undetectable atmospheric waves. Just below that, a small spot represents a lingering remnant from the “Great Springtime Storm” of 2011 to 2012. Several other storms dotting the southern hemisphere of Saturn are visible in Webb’s image, as well.
All these features are shaped by powerful winds and waves beneath the visible cloud deck, making Saturn a natural laboratory for studying fluid dynamics under extreme conditions.
Are they weather patterns? #
This video features views of Saturn from the NASA/ESA/CSA James Webb Space Telescope and the NASA/ESA Hubble Space Telescope that reveals the planet in infrared and visible light. Hubble highlights subtle cloud banding and colour variations, while Webb’s infrared vision probes different atmospheric layers, bringing out storms, waves, and glowing ring structures in striking detail. Credit: NASA, ESA, CSA, STScI, A. Simon (NASA-GSFC), M. Wong (University of California) J. DePasquale (STScI), N. Bartmann (ESA/Webb). Music: Stellardrone - Twilight
In Webb’s infrared observations, Saturn’s poles appear distinctly grey-green, indicating light emitting at wavelengths around 4.3 microns. This distinct feature could come from a layer of high-altitude aerosols in Saturn’s atmosphere that scatters light differently at those latitudes. Another possible explanation is auroral activity, as charged molecules interacting with the planet’s magnetic field can produce glowing emissions near the poles.
In Webb’s infrared image, the rings are extremely bright because they are made of highly reflective water ice. In both images, we’re seeing the sunlit face of the rings, a little less so in the Hubble image, hence the shadows visible underneath on the planet.
Saturn’s orbit around the Sun, combined with the position of Earth in its annual orbit, determines our changing viewing angle of Saturn’s face and ring.
Hubble’s observations of Saturn for decades have built a record of its evolving atmosphere. Programs like OPAL, with its annual monitoring, have allowed scientists to track storms, banding patterns, and seasonal shifts over time. Webb now adds powerful infrared capabilities to this ongoing record, extending what researchers can measure about Saturn’s atmospheric structure and dynamic processes.
Contact [Notaspampeanas](mailto: notaspampeanas@gmail.com)